
Create xyz-axis for PyMol
Summary: When show protein unit cell in PyMol, I want to show xyz axis, but PyMol doesn’t have this option. Here is a solution.
Contents:
- Step 1: Create xyz axis file
- Step 2: Edit the xyz_move.pdb file in PyMol
- Step 3: Show xyz-axis in PyMol
Check this blog on github
*The code and file are available here
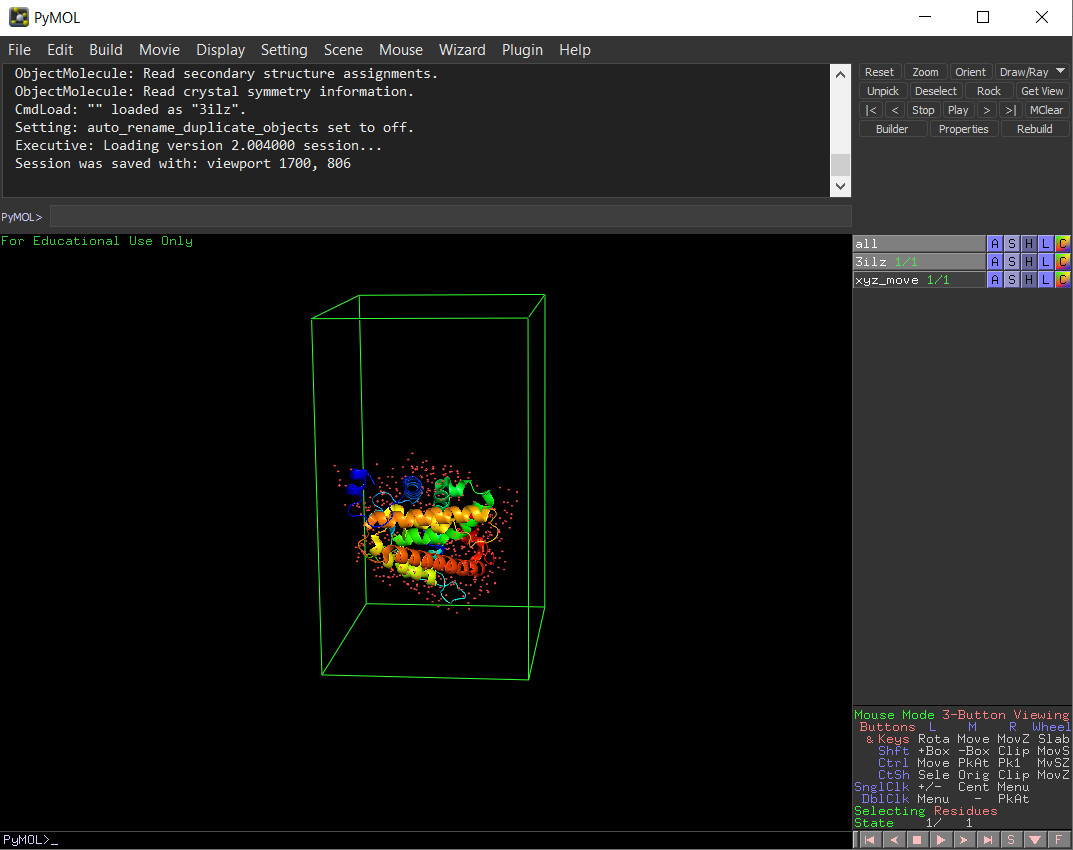 fig 1: Preview of protein unit cell
Step 1: Create xyz axis file
The following MATLAB code is used to create xyz axis.
%set origin point to (-10,-10,-10)
x=1:50;
a_axis = zeros(length(x),3);
a_axis(:,1) = x';
b_axis = zeros(length(x),3);
b_axis(:,2) = x';
c_axis = zeros(length(x),3);
c_axis(:,3) = x';
abc_axis=[a_axis; b_axis; c_axis];
abc_axis=abc_axis-10;

fl_ID_name="xyz_move.pdb";
fl_ID=fopen(fl_ID_name,'w');
for m=1:length(abc_axis)
    x=abc_axis(m,1);
    y=abc_axis(m,2);
    z=abc_axis(m,3);
    fprintf(fl_ID,'%4s%7d%3s                %8.3f%8.3f%8.3f%6.2f%6.2f\n',... %%%16 spaces
                'ATOM',m,'  H',x,y,z,1.0,0.05);
end
The axis’ origin point is set to (-10, -10, -10) so that it won’t overlap with the unit cell origin. Each axis has 50 points.
Step 2: Edit the xyz_move.pdb file in PyMol
Open the xyz_move.pdb file in PyMol(fig 2):
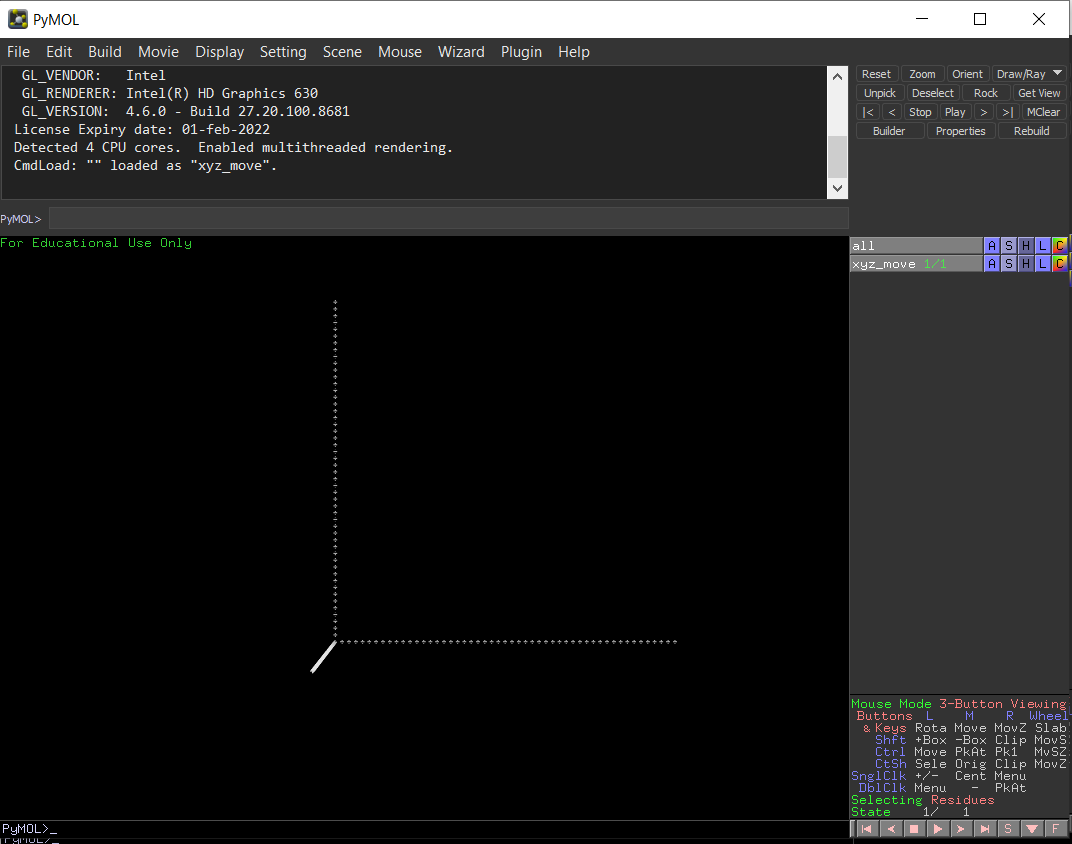 fig 2: Show xyz_move.pdb in PyMol
Select xyz axis
Type following command one by one in the command input area:
select a, id 1-50 # x-axis

select b, id 51-100 # y-axis

select c, id 101-150 #z-axis
*Learn PyMol command at here
Now it looks like this:
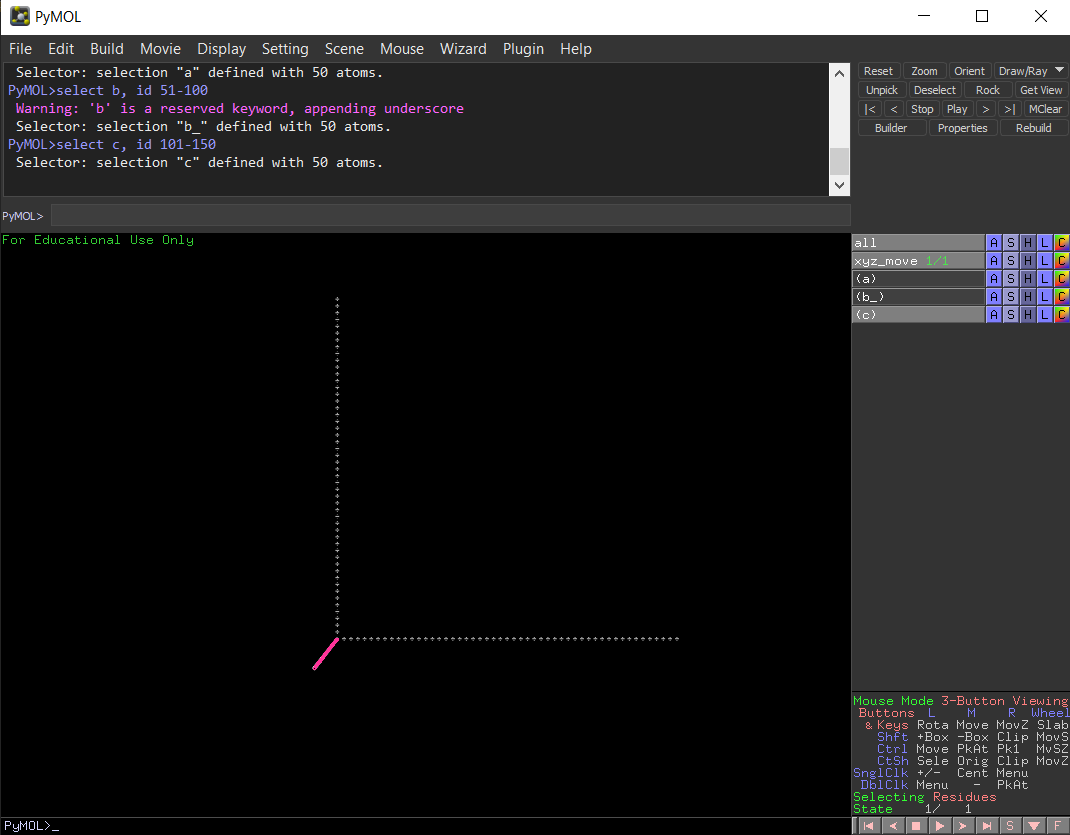 fig 3: Select xyz axis in PyMol
Color xyz axis
Look at the red block in fig 4, for the selected
- a, click C, then choose red -> red
- b, click C, then choose green -> greem
- c, click C, then choose blue -> blue
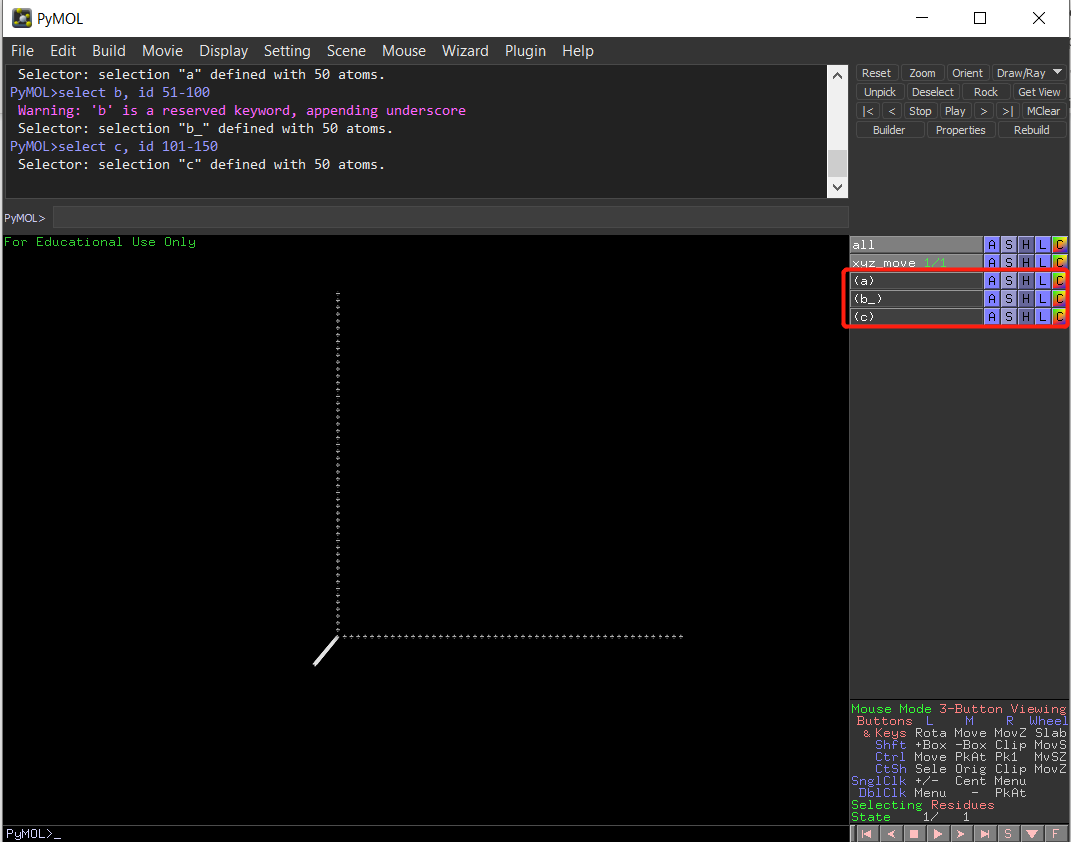
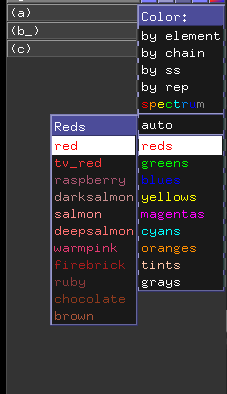
fig 4: Color xyz axis
Now xyz axis has been colored with red, green, blue respectively.
Label xyz
Right click the last atom at x-axis, menu -> edit label (upper figure in fig 5). In the middle figure, at right lower corner, choose label size: 36, at left upper corner, input capital x, enter.
Same for the y, z axis.
The result is in the lower figure.
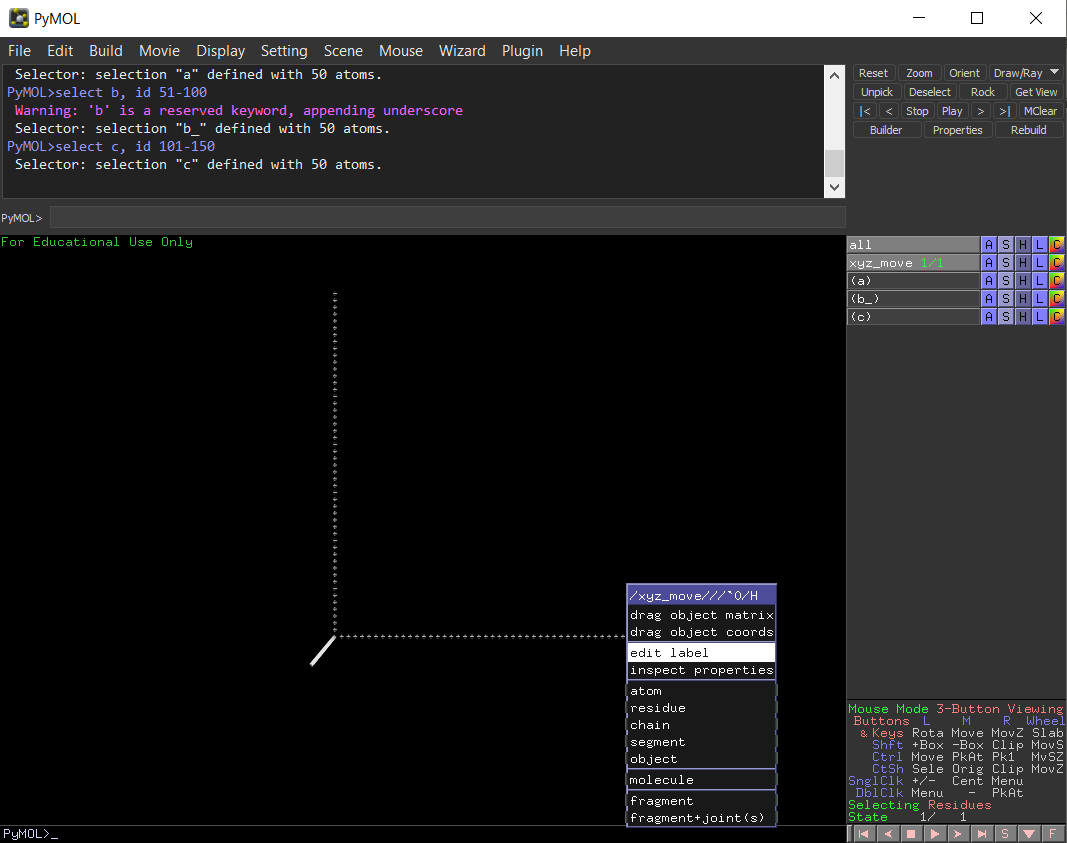
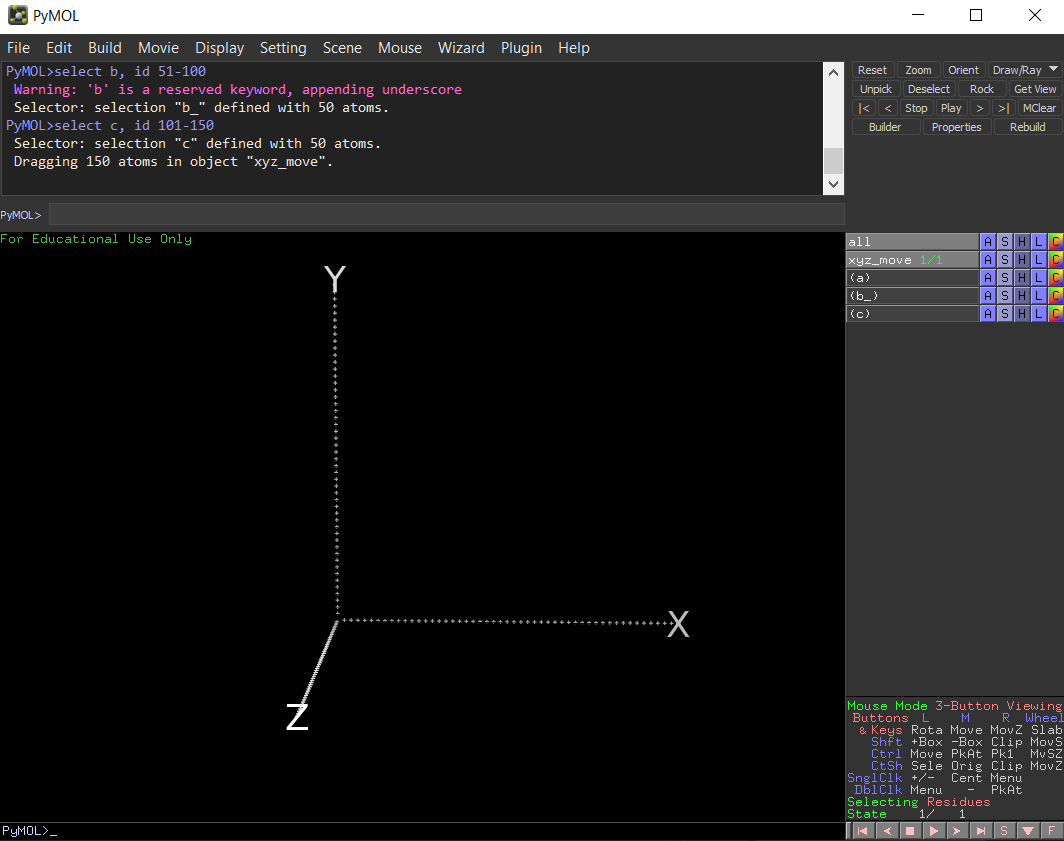 fig 5: Label xyz axis
Click File -> Save Session, named xyz_move_colored.pse.
Step 3: Show xyz-axis in PyMol
Open the saved session, choose “Merge with current session”, now you will see fig 6.
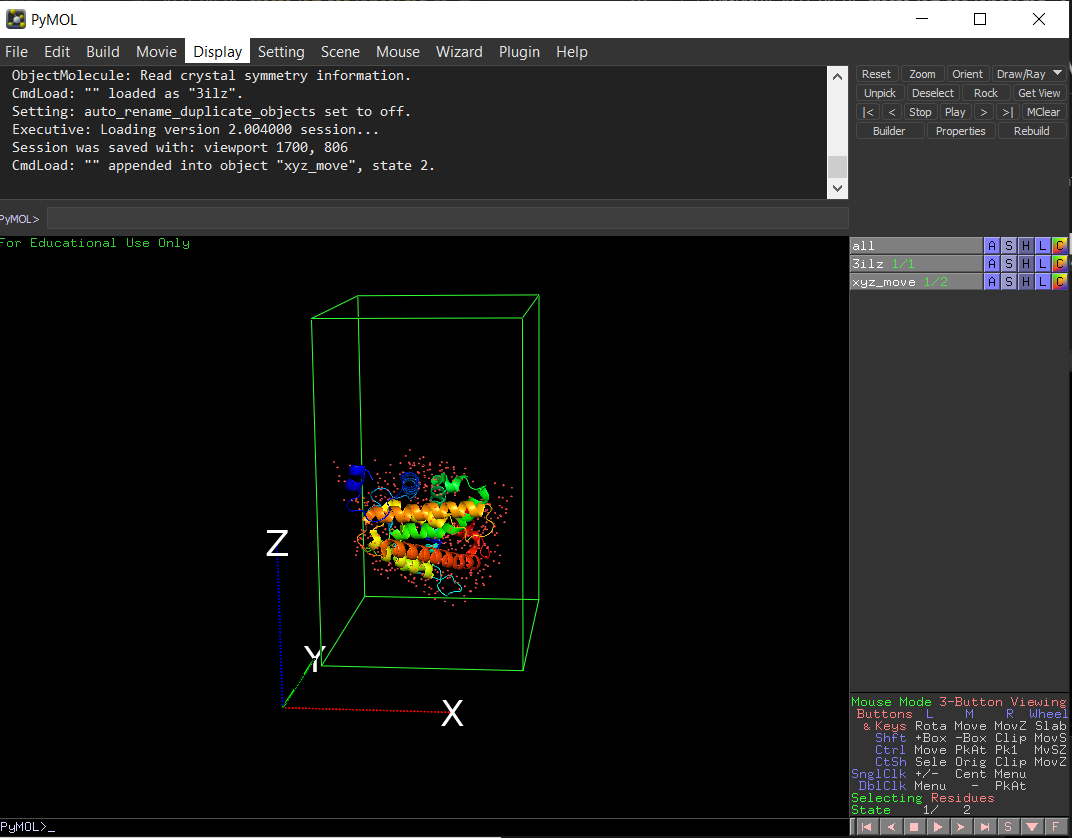 fig 6: Show xyz axis in PyMol

Comments