
Web Map with Folium
Summary: Build a web map with Folium.
Check this blog on github.
Contents:
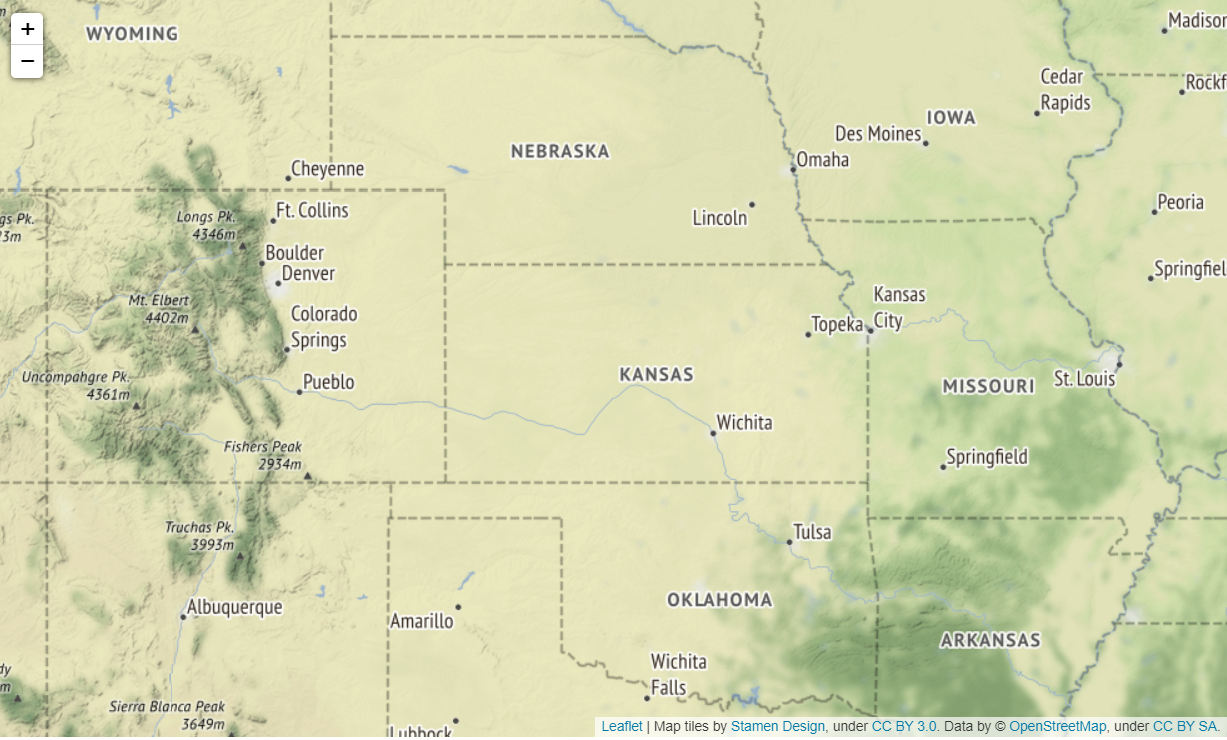
1. Create a map
#import packages
import folium
import pandas as pd
mp = folium.Map(location=[38.58, -99.09], zoom_start=6, tiles="Stamen Terrain")
mp.save("Map1.html")
mp
2. Add marker
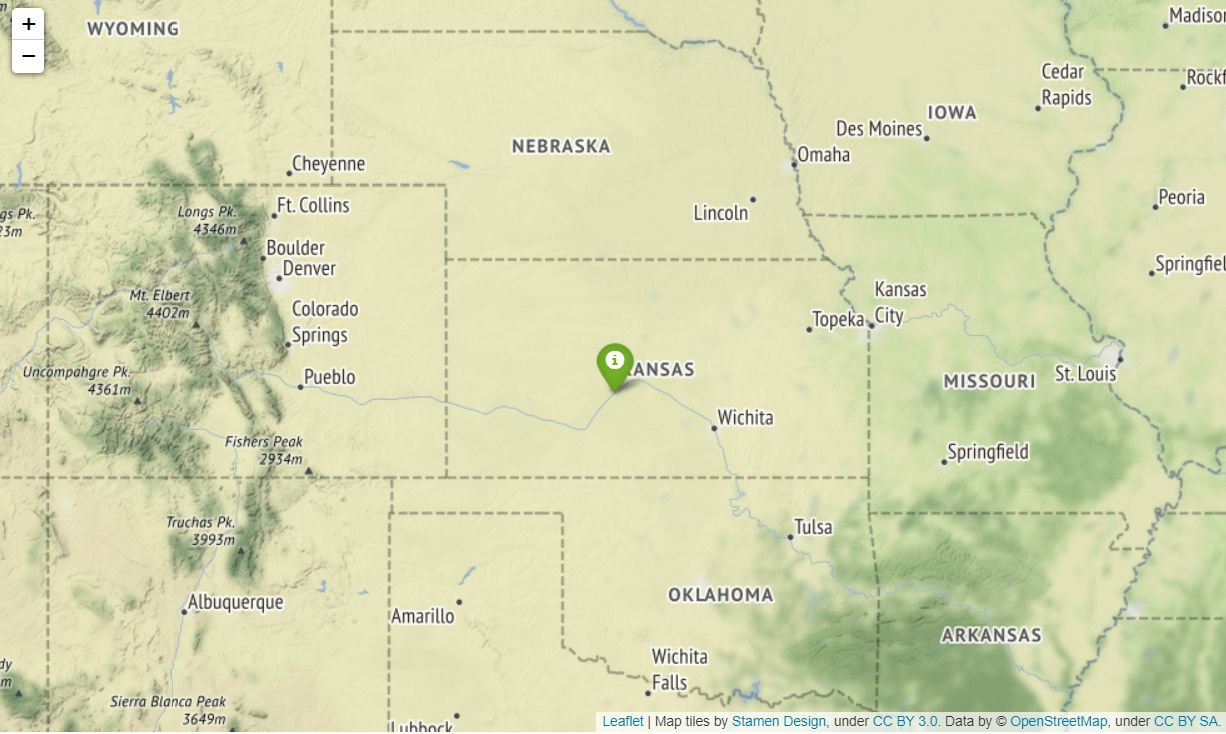
2.1 Add single marker
mp = folium.Map(location=[38.58, -99.09], zoom_start=6, tiles="Stamen Terrain")
fg = folium.FeatureGroup(name="My map")
fg.add_child(folium.Marker(location=[38.2, -99.1], popup="I am a marker", tooltip="click me", icon=folium.Icon(color="green")))
mp.add_child(fg)
mp.save("Map1.html")
mp
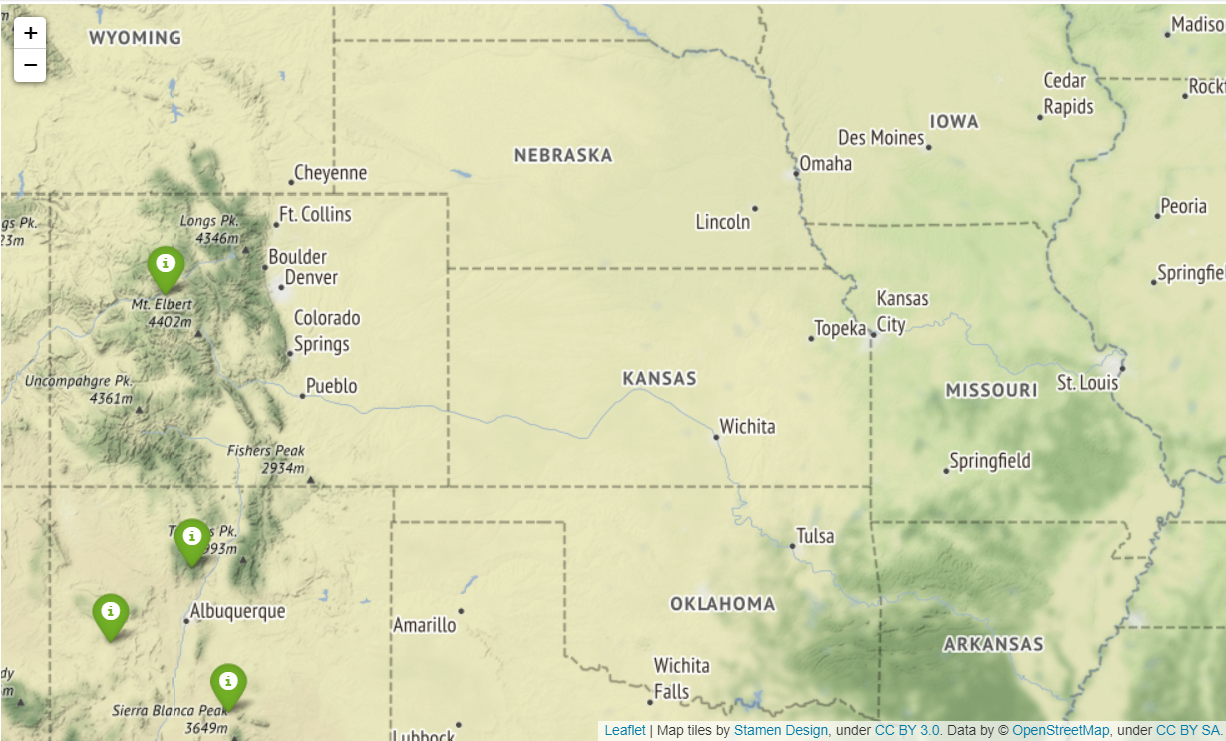
2.2 Add multiple markers from file
data = pd.read_csv("Volcanoes.txt")

#data = pd.read_csv("Volcanoes.txt")
lat = list(data["LAT"])
lon = list(data["LON"])

mp = folium.Map(location=[38.58, -99.09], zoom_start=6, tiles="Stamen Terrain")

fg = folium.FeatureGroup(name="My map")

for lt, ln in zip(lat, lon):
    fg.add_child(folium.Marker(location=[lt, ln], popup="I am a marker", tooltip="click me",
                              icon=folium.Icon(color="green")))

mp.add_child(fg)
mp.save("Map1.html")
mp
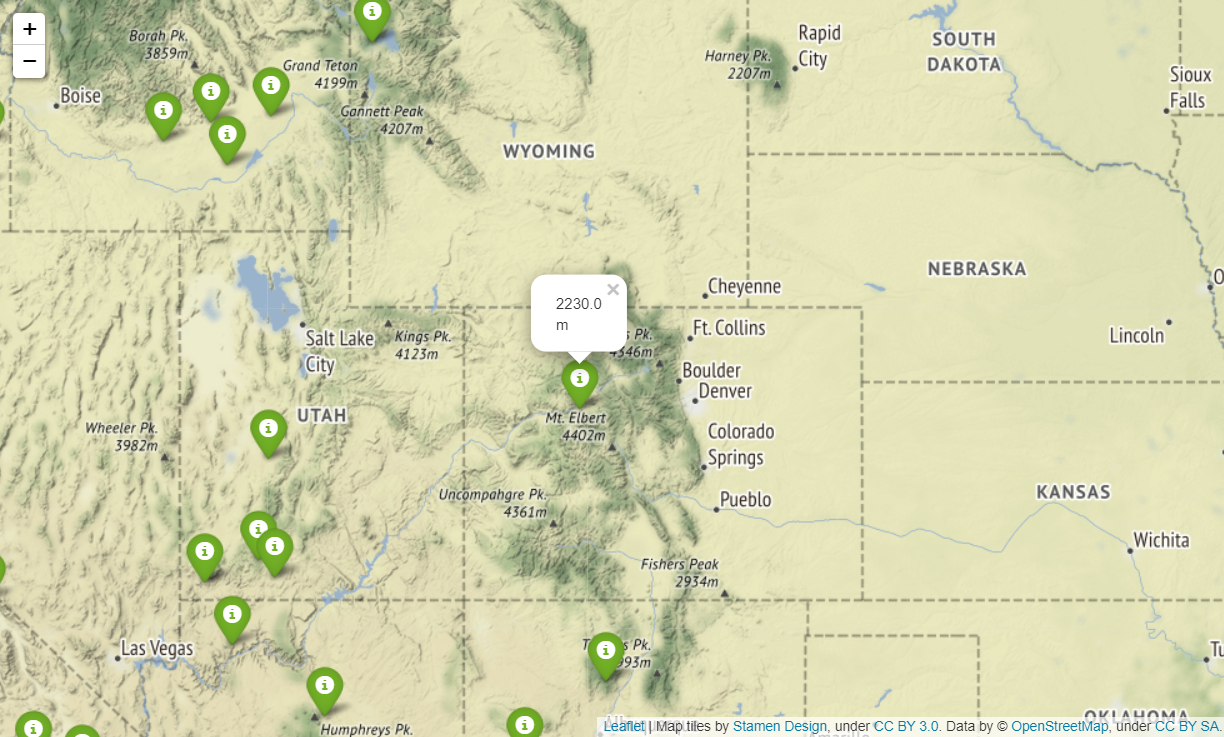
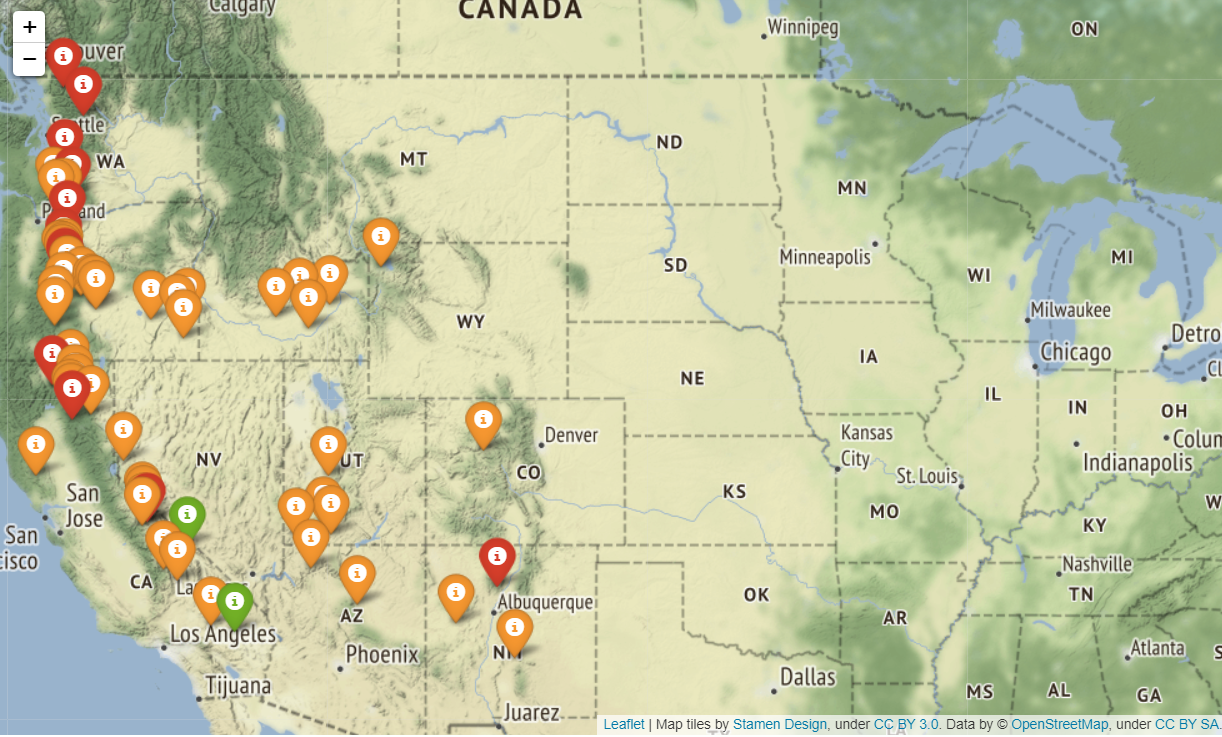
2.3 Add elevation to popup
#data = pd.read_csv("Volcanoes.txt")
lat = list(data["LAT"])
lon = list(data["LON"])
elev = list(data["ELEV"])

mp = folium.Map(location=[38.58, -99.09], zoom_start=6, tiles="Stamen Terrain")

fg = folium.FeatureGroup(name="My map")

for lt, ln, el in zip(lat, lon, elev):
    fg.add_child(folium.Marker(location=[lt, ln], popup=str(el)+" m", tooltip="click me",
                              icon=folium.Icon(color="green")))

mp.add_child(fg)
mp.save("Map1.html")
mp
2.4 Color generate function for markers
#data = pd.read_csv("Volcanoes.txt")
lat = list(data["LAT"])
lon = list(data["LON"])
elev = list(data["ELEV"])

#color markers by elevation
def color_producer(elevation):
    if elevation < 1000:
        return "green"
    elif 1000 <= elevation < 3000:
        return "orange"
    else:
        return "red"

mp = folium.Map(location=[38.58, -99.09], zoom_start=6, tiles="Stamen Terrain")

fg = folium.FeatureGroup(name="My map")

for lt, ln, el in zip(lat, lon, elev):
    fg.add_child(folium.Marker(location=[lt, ln], popup=str(el)+" m", tooltip="click me",
                              icon=folium.Icon(color=color_producer(el))))

mp.add_child(fg)
mp.save("Map1.html")
mp
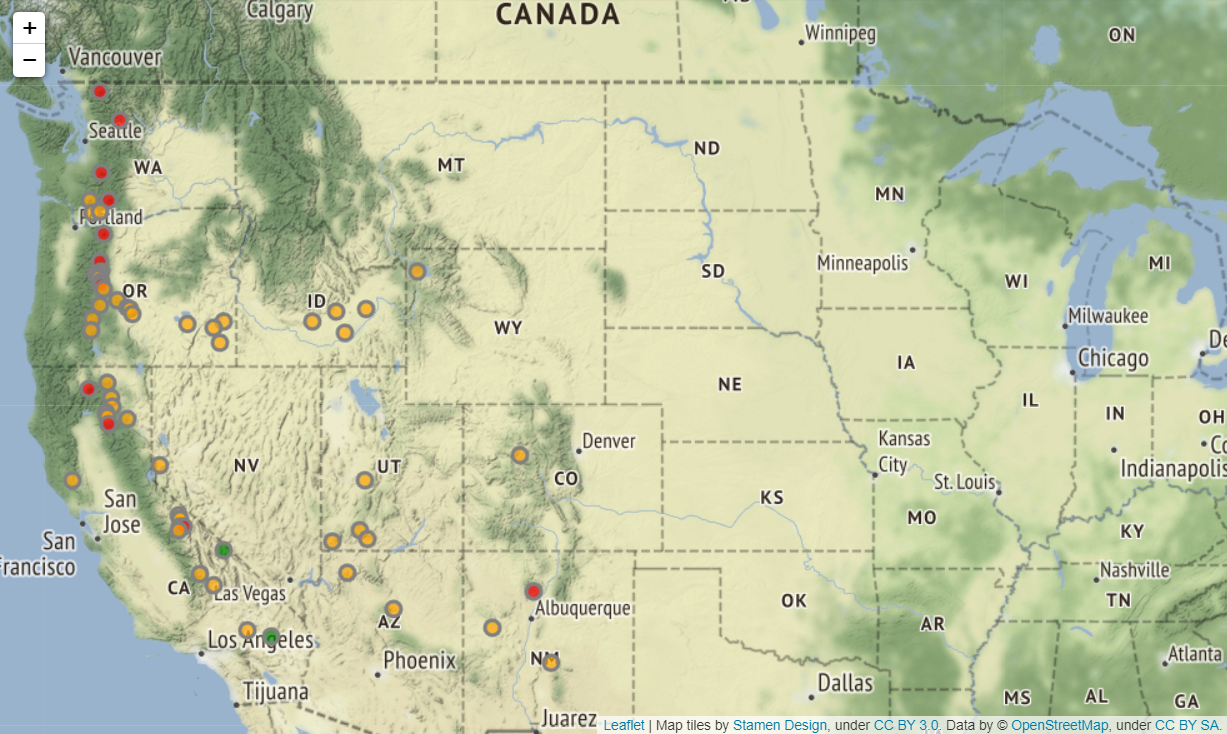
2.5 Circle markers
#data = pd.read_csv("Volcanoes.txt")
lat = list(data["LAT"])
lon = list(data["LON"])
elev = list(data["ELEV"])

#color markers by elevation
def color_producer(elevation):
    if elevation < 1000:
        return "green"
    elif 1000 <= elevation < 3000:
        return "orange"
    else:
        return "red"

mp = folium.Map(location=[38.58, -99.09], zoom_start=6, tiles="Stamen Terrain")

fg = folium.FeatureGroup(name="My map")

for lt, ln, el in zip(lat, lon, elev):
    fg.add_child(folium.CircleMarker(location=[lt, ln], radius=6, popup=str(el)+" m",
                fill_color=color_producer(el), color="grey", fill=True, fill_opacity=0.7))

mp.add_child(fg)
mp.save("Map1.html")
mp
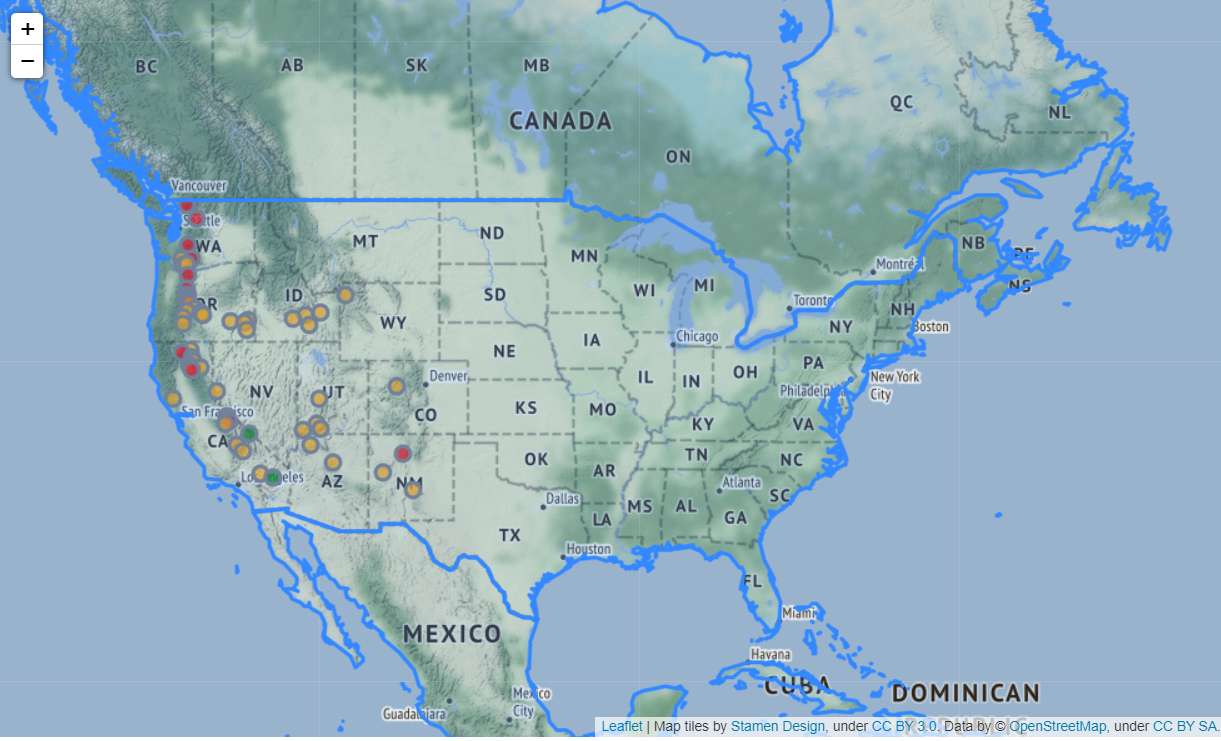
3. Add population layer with json data
3.1 Add population layer
#data = pd.read_csv("Volcanoes.txt")
lat = list(data["LAT"])
lon = list(data["LON"])
elev = list(data["ELEV"])

#color markers by elevation
def color_producer(elevation):
    if elevation < 1000:
        return "green"
    elif 1000 <= elevation < 3000:
        return "orange"
    else:
        return "red"

mp = folium.Map(location=[38.58, -99.09], zoom_start=6, tiles="Stamen Terrain")

fg = folium.FeatureGroup(name="My map")

#use circle marker
for lt, ln, el in zip(lat, lon, elev):
    fg.add_child(folium.CircleMarker(location=[lt, ln], radius=6, popup=str(el)+" m",
                fill_color=color_producer(el), color="grey", fill=True, fill_opacity=0.7))

    #add world layer
fg.add_child(folium.GeoJson(data=open("world.json", "r", encoding="utf-8-sig").read()))

mp.add_child(fg)
mp.save("Map1.html")
mp
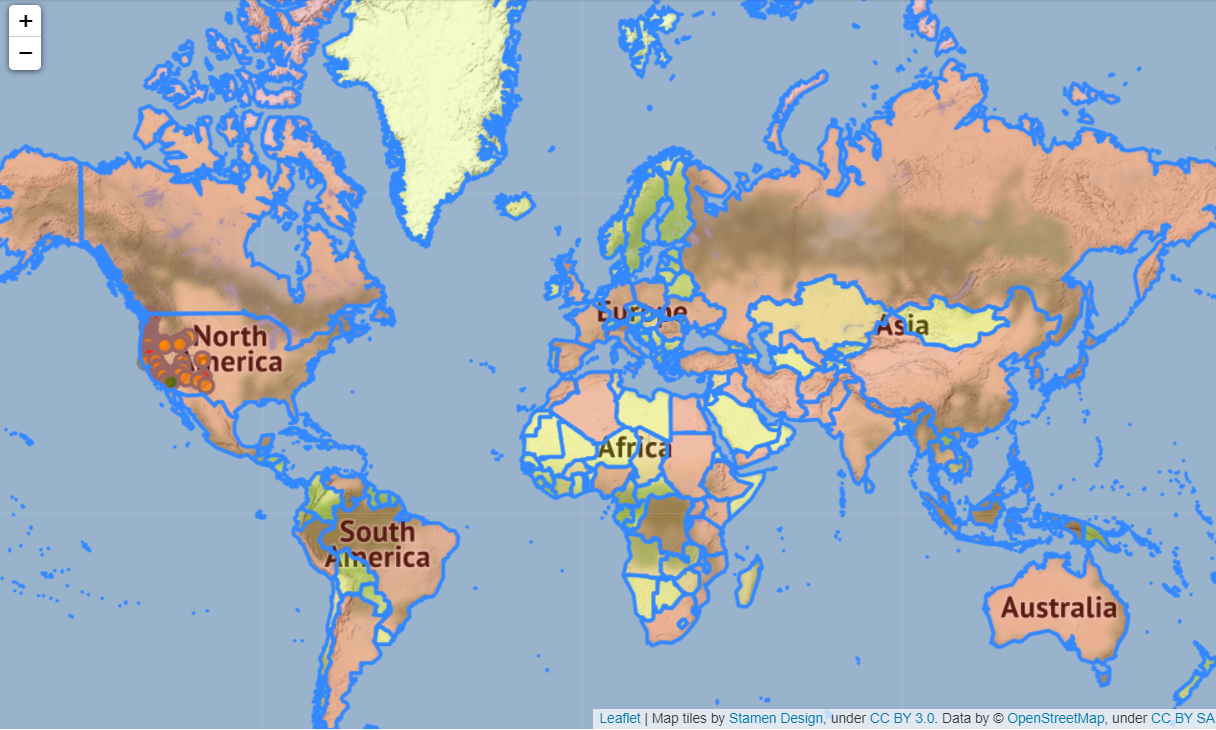
3.2 Stylize the population layer
Color the country by its population.
#data = pd.read_csv("Volcanoes.txt")
lat = list(data["LAT"])
lon = list(data["LON"])
elev = list(data["ELEV"])

#color markers by elevation
def color_producer(elevation):
    if elevation < 1000:
        return "green"
    elif 1000 <= elevation < 3000:
        return "orange"
    else:
        return "red"

mp = folium.Map(location=[38.58, -99.09], zoom_start=6, tiles="Stamen Terrain")

fg = folium.FeatureGroup(name="My map")

#use circle marker
for lt, ln, el in zip(lat, lon, elev):
    fg.add_child(folium.CircleMarker(location=[lt, ln], radius=6, popup=str(el)+" m",
                fill_color=color_producer(el), color="grey", fill=True, fill_opacity=0.7))

#add world layer
fg.add_child(folium.GeoJson(data=open("world.json", "r", encoding="utf-8-sig").read(),
    style_function=lambda x: {"fillColor":"yellow" if x["properties"]["POP2005"] < 10000000
    else "orange" if 10000000 <= x["properties"]["POP2005"] < 20000000 else "red" }))

mp.add_child(fg)
mp.save("Map1.html")
mp
4 Add layer control panel
#data = pd.read_csv("Volcanoes.txt")
lat = list(data["LAT"])
lon = list(data["LON"])
elev = list(data["ELEV"])

#color markers by elevation
def color_producer(elevation):
    if elevation < 1000:
        return "green"
    elif 1000 <= elevation < 3000:
        return "orange"
    else:
        return "red"

mp = folium.Map(location=[38.58, -99.09], zoom_start=6, tiles="Stamen Terrain")

fg = folium.FeatureGroup(name="My map")

#use circle marker
for lt, ln, el in zip(lat, lon, elev):
    fg.add_child(folium.CircleMarker(location=[lt, ln], radius=6, popup=str(el)+" m",
                fill_color=color_producer(el), color="grey", fill=True, fill_opacity=0.7))

#add world layer
fg.add_child(folium.GeoJson(data=open("world.json", "r", encoding="utf-8-sig").read(),
    style_function=lambda x: {"fillColor":"yellow" if x["properties"]["POP2005"] < 10000000
    else "orange" if 10000000 <= x["properties"]["POP2005"] < 20000000 else "red" }))

mp.add_child(fg)
mp.add_child(folium.LayerControl()) #add layer control panel

mp.save("Map1.html")
mp
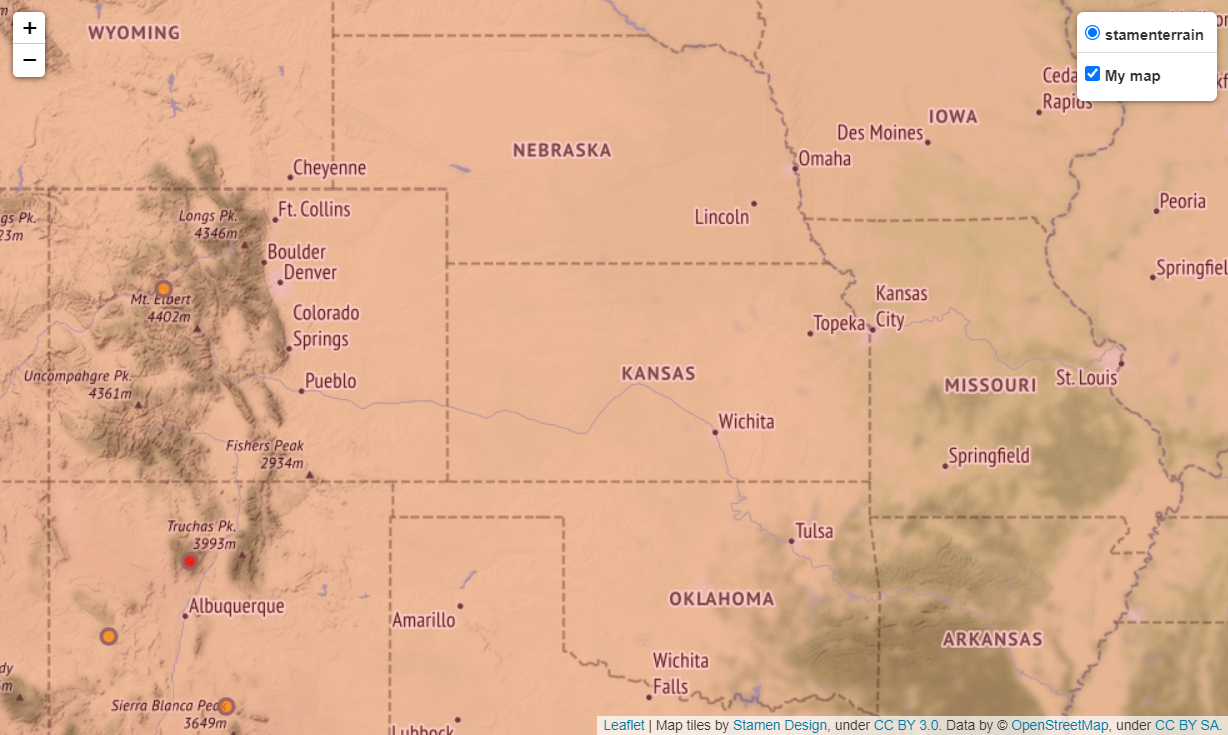
Now you only have one layer with name "My map", because you only have one layer fg. To control different layers seperately, we need to set different name for different layer.
#data = pd.read_csv("Volcanoes.txt")
lat = list(data["LAT"])
lon = list(data["LON"])
elev = list(data["ELEV"])

#color markers by elevation
def color_producer(elevation):
    if elevation < 1000:
        return "green"
    elif 1000 <= elevation < 3000:
        return "orange"
    else:
        return "red"

mp = folium.Map(location=[38.58, -99.09], zoom_start=6, tiles="Stamen Terrain")

fgv = folium.FeatureGroup(name="Volcanoes")

#use circle marker
for lt, ln, el in zip(lat, lon, elev):
    fgv.add_child(folium.CircleMarker(location=[lt, ln], radius=6, popup=str(el)+" m",
                fill_color=color_producer(el), color="grey", fill=True, fill_opacity=0.7))

fgp = folium.FeatureGroup(name="Population")
#add world layer
fgp.add_child(folium.GeoJson(data=open("world.json", "r", encoding="utf-8-sig").read(),
    style_function=lambda x: {"fillColor":"yellow" if x["properties"]["POP2005"] < 10000000
    else "orange" if 10000000 <= x["properties"]["POP2005"] < 20000000 else "red" }))

mp.add_child(fgv)
mp.add_child(fgp)
mp.add_child(folium.LayerControl()) #add layer control panel

mp.save("Map1.html")
mp
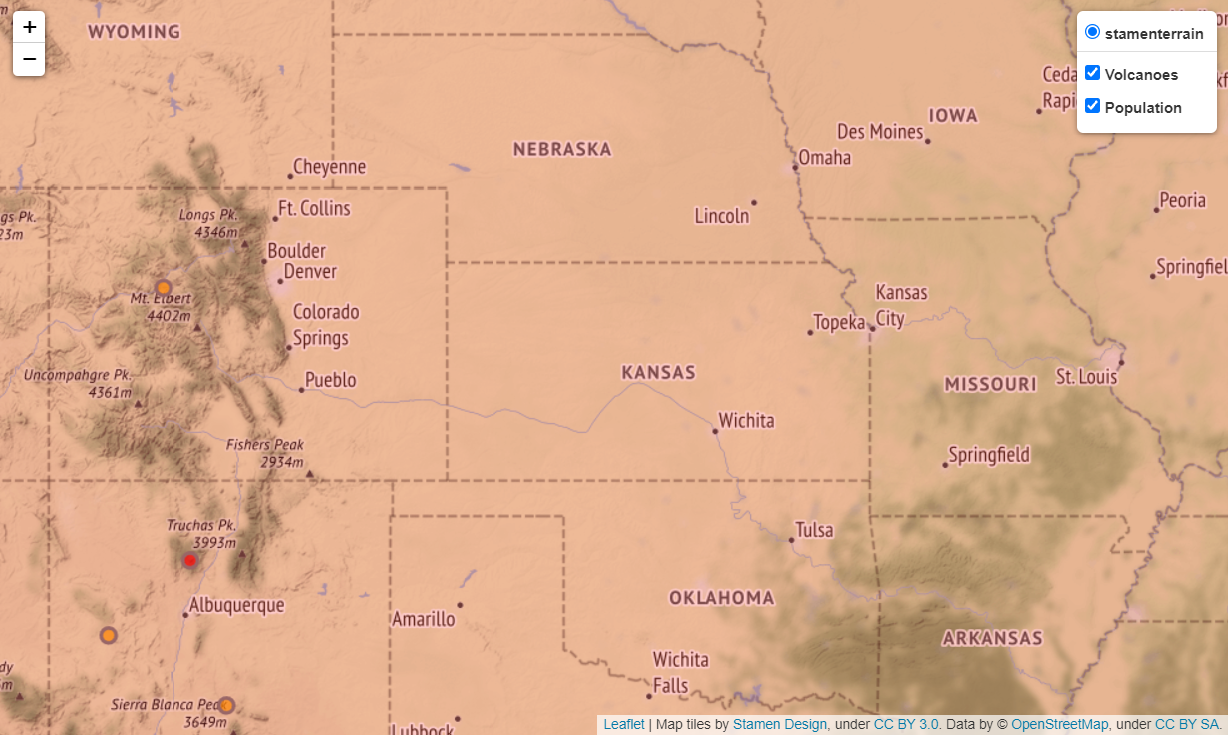
Now there are two layers: Volcanoes and Population.

Comments