
Deploy Bokeh Server App on Heroku
Summary: deploy Bokeh server app on Heroku.
This blog is about bokeh serve method , another blog about Bokeh’s CustomJS method can be found here.
Check this blog on github.
App web: https://yc-bokeh-server2.herokuapp.com/ Code: <>
Contents:
1. Introduction
According to Bokeh’s introduction on widgets:
There are two ways to use a widget’s functionality:
-
A
CustomJScallback. This approach will work in standalone HTML documents or Bokeh server apps. -
Use
bokeh serveto start a Bokeh server and set up event handlers with.on_change(or for some widgets,.on_click).
The standalone method has been tried at here.
Now let’s try bokeh serve method.
2. python scripts
Overview of the folder structure:
📦Demo
 ┣ 📂data
 ┃ ┣ 📜arr_delay.csv
 ┃ ┗ 📜Hou_flights.csv
 ┣ 📂scripts
 ┃ ┣ 📜density.py
 ┃ ┣ 📜draw_map.py
 ┃ ┣ 📜histogram.py
 ┃ ┣ 📜routes.py
 ┃ ┣ 📜table.py
 ┃ ┗ 📜__init__.py
 ┣ 📜main.py
 ┣ 📜Procfile
 ┣ 📜requirements.txt
 ┗ 📜runtime.txt
main.py
import sys
sys.path.insert(0, './scripts')
import pandas as pd
import numpy as np

# Bokeh basics
from bokeh.io import curdoc, show
from bokeh.models import Tabs, Column, Row

from routes import route_tab


# Load in flights and inspect
flights = pd.read_csv('./data/Hou_flights.csv', index_col=0).dropna()

# Create each of the tabs
tab_route = route_tab(flights)

# Put all the tabs into one application
tabs = Tabs(tabs = [tab_route])
#show(tabs)
# Put the tabs in the current document for display
curdoc().add_root(tabs)

#in the app_demo folder, activate python env, run bokeh serve --show main.py
./scripts/routes.py
from bokeh.plotting import figure

from bokeh.models import (CategoricalColorMapper, HoverTool,
						  ColumnDataSource, Panel,
						  FuncTickFormatter, SingleIntervalTicker, LinearAxis)

from bokeh.models import (CheckboxGroup, Slider, RangeSlider,
								  Tabs, CheckboxButtonGroup,
								  TableColumn, DataTable, Select, Column, Row)

from bokeh.palettes import Category20_16

# List of lists to single list
from itertools import chain

def route_tab(flights):

	# Make dataset for plot based on route start (origin) and
	# end (destination)
	def make_dataset(origin, destination):
		# Subset to the selected route
		subset = flights[(flights['Dest'] == destination) & (flights['Origin'] == origin)]

		# Find the carriers who cover particular route
		carriers = list(set(subset['name']))

		# x is the delay, y is the airline
		xs = []
		ys = []
		label_dict = {}

		# Iterate through the unique carriers
		for i, carrier in enumerate(carriers):

			# Subset to the carrier
			carrier_data = subset[subset['name'] == carrier]

			# Append the index of the carrier as many times as there are flights
			# Append the delays for the carrier
			ys.append([i for _ in range(len(carrier_data))])
			xs.append(list(carrier_data['ArrDelay']))

			# Map the index to the carrier
			label_dict[i]= carrier

		xs = list(chain(*xs))
		ys = list(chain(*ys))

		new_src = ColumnDataSource(data = {'x': xs, 'y': ys})

		return new_src, label_dict


	def make_plot(src, origin, destination, label_dict):

		p = figure(plot_width = 800, plot_height = 400, x_axis_label = 'Delay (min)', y_axis_label = '',
                title = 'Arrival Delays for Flights from %s to %s' % (origin, destination))


		p.circle('x', 'y', source = src, alpha = 0.4,
				 color = 'navy', size = 15)


		p.yaxis[0].ticker.desired_num_ticks = len(label_dict)

		p.yaxis.formatter = FuncTickFormatter(code = """
							var labels = %s;
							return labels[tick];
							""" % label_dict)

		return p

	def style(p):
		# Title
		p.title.align = 'center'
		p.title.text_font_size = '20pt'
		p.title.text_font = 'serif'

		# Axis titles
		p.xaxis.axis_label_text_font_size = '14pt'
		p.xaxis.axis_label_text_font_style = 'bold'
		p.yaxis.axis_label_text_font_size = '14pt'
		p.yaxis.axis_label_text_font_style = 'bold'

		# Tick labels
		p.xaxis.major_label_text_font_size = '12pt'
		p.yaxis.major_label_text_font_size = '12pt'

		return p

	def update(attr, old, new):
		# Origin and destination determine values displayed
		origin = origin_select.value
		destination = dest_select.value

		# Get the new dataset
		new_src, label_dict = make_dataset(origin, destination)

		if len(label_dict) == 0:
			p.title.text = 'No Flights on Record from %s to %s' % (origin, destination)

		else:
			p.yaxis[0].ticker.desired_num_ticks = len(label_dict)
			p.yaxis.formatter = FuncTickFormatter(code = """
								var labels = %s;
								return labels[tick];
								""" % label_dict)

			p.title.text = 'Arrival Delays for Flights from %s to %s' % (origin, destination)

		src.data.update(new_src.data)

	origins = list(set(flights['Origin']))
	dests = list(set(flights['Dest']))

	origin_select = Select(title = 'Origin', value = 'IAH', options = origins)
	origin_select.on_change('value', update)

	dest_select = Select(title = 'Destination', value = 'JFK', options = dests)
	dest_select.on_change('value', update)

	initial_origin = origin_select.value
	initial_dest = dest_select.value

	src, label_dict = make_dataset(initial_origin, initial_dest)

	p = make_plot(src, initial_origin, initial_dest, label_dict)
	p = style(p)

	layout = Row(Column(origin_select, dest_select), p)

	tab = Panel(child = layout, title = 'Route Details')

	return tab
Run server locally:
In the Demo folder, under python environment, run
bokeh serve --show main.py
The result will be on: http://localhost:5006/main
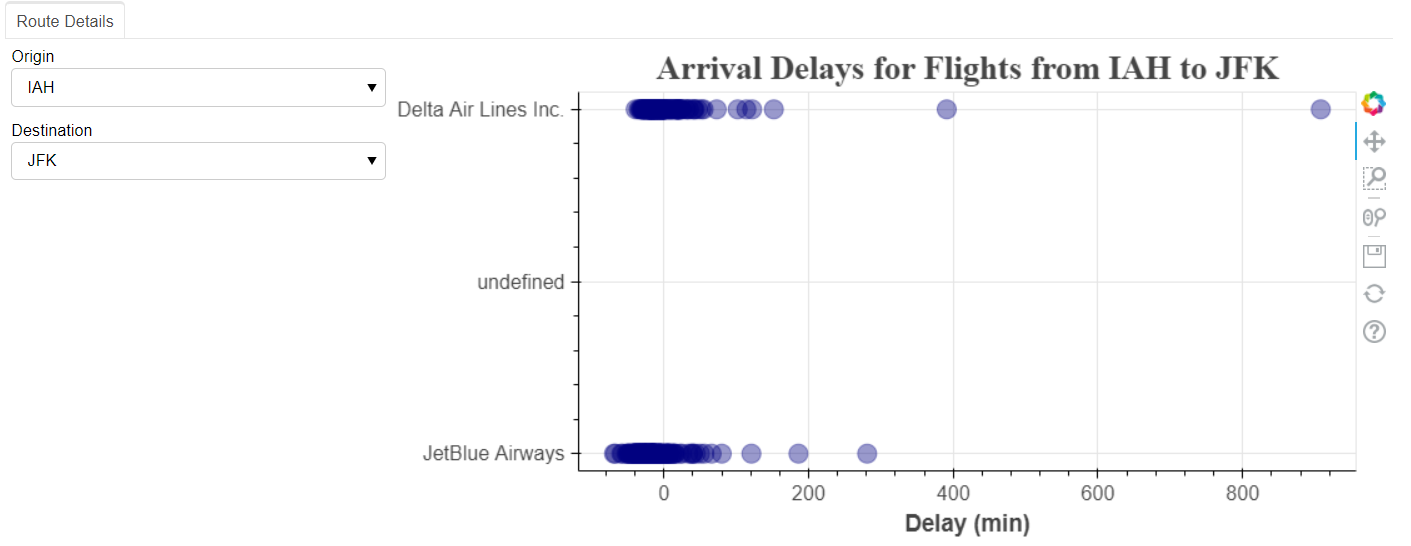 fig 1: Routes with bokeh serve
3. Create virtual environment
To deploy the web, Create folder Bokeh_serve_demo, move all necessary files to Bokeh_serve_demo/Demo.
-
Install virtualenv package:
pip install virtualenv. -
Create new virtual environment:
python -m venv virtual -
Activate the new virtualenv:
change directory to virtual/Scripts, run
activate.note: windows cmd prompt can run
activate, git cmd cannot. -
change directory to
Demo -
Install necessary packages for this app:
pip install bokehpip install pandaspip install scipy.etc
-
Run demo locally with new virtual env:
bokeh serve --show main.py
The result will be on: http://localhost:5006/main
4. Deploy the app to Heroku
- create Heroku account
- Install Heroku CLI
-
Login Heroku in cmd prompt:
In folder
Bokeh_serve_demo/Demo:heroku loginbrowser will open and click login.
-
List your apps on Heroku:
heroku apps -
Create apps:
heroku create app-nameWebsite address:
app-name.herokuapp.com -
Get a list of packages of the new virtual env
pip freeze -
Install gunicorn
pip install gunicorn -
Write packages info to
requirements.txtpip freeze > requirements.txt -
Create
Procfile(no file extension)web: bokeh serve --port=$PORT --allow-websocket-origin=yc-bokeh-server2.herokuapp.com --address=0.0.0.0 --use-xheaders main.py*Note:
yc-bokeh-serveris the app name. -
Create
runtime.txt, specify the python version, check the website https://devcenter.heroku.com/articles/python-runtimes#supported-python-runtimespython-3.9.6*Note: in this specific app, the above python version has Error, change the python version to
python-3.8.12works. -
Git
git init
git add .
git commit -m "message"
Heroku git:remote --app app-name
git push heroku master
If everything works right, you can check your app at https://yc-bokeh-server2.herokuapp.com/.
If something goes wrong, run heroku logs --tail
Comments